Google Chartでスケールの違う2つの折れ線グラフをうまいこと出す
2つの折れ線グラフを出そうとして、1つは値の幅が(A)0-200、もう片方は(B)0-4000とかで、これを何も考えず同時にプロットすると、AがBの範囲で、つまり0-4000の中で0-200が表示されるため、結果Aのグラフがほぼ平坦になってしまうわけです。
で、ドキュメントを調べていたらtargetAxisIndexというのをseriesに指定するとYou can define a different scale for different axesだよって書いてあったので、これを指定したらうまいことスケール( = 値の幅)の違うグラフが表示できました。
targetAxisIndex - Which axis to assign this series to, where 0 is the default axis, and 1 is the opposite axis. Default value is 0; set to 1 to define a chart where different series are rendered against different axes. At least one series much be allocated to the default axis. You can define a different scale for different axes.
http://code.google.com/intl/ja/apis/chart/interactive/docs/gallery/linechart.html
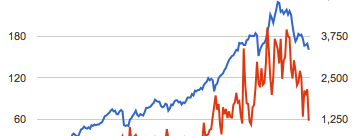
ちょっと画像きれてますけど、こんな感じで左右にそれぞれの値の幅が表示されます。

コードはこんな感じ。seriesの1ってのが2つ目のグラフで(0始まりなので)、targetAxisIndexを1にすると反対の軸を使うよってことです。
var options = {
  series: {
    1: {targetAxisIndex: 1}
  }
};
var chart = new google.visualization.LineChart(document.getElementById('chart'));
chart.draw(data, options);